ThreatX Dashboard
The Dashboard, available from the navigation bar, displays essential data collected for each site in your environment under ThreatX protection. The data is live and driven by active site traffic.
-
Monitor changes.
-
Review details about a specific threat.
-
Determine if traffic from an origin is to be allowed or blocked.
-
Identify unexpected usage patterns.
Pages
The ThreatX dashboard pages offer the following controls and filters that you can use to focus on specific data.

| Site group |
If your ThreatX platform organizes sites into groups, you can choose which group to view. You can view one site group or all site groups. |
| Sites |
You can display the data for one or all sites. |
| Tenant |
If your ThreatX platform has many tenants and your account has permission, you can choose which tenant to view. You can view one tenant only at a time. |
| Live |
Refreshes the data. |
| Time range |
Choose the time frame to view the data. You can choose a relative time frame, such as the last 12 hours, or an absolute time frame. The time range you select for each page affects the data shown on that page. |
Tables
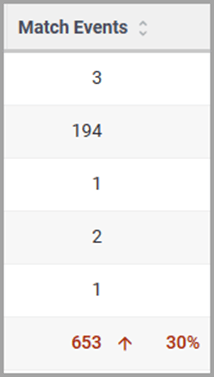
Some data in the various tables include a percentage with an arrow. The value indicates a change in the data relative to the baseline reporting period, which is 7 days before the selected time range.
For example, when you select a 12-hour time range, the baseline period is the same 12-hour period from 7 days previous. The arrow indicates an increase or decrease in value. The following figure shows an increase in the number of Match Events of 30%.
|
Searching
|
Attack Dashboard
📊 Graphs
The Dashboard includes graphs and three tables. Each table is a different perspective of the organization’s attack surface.
- All Requests
-
Displays the total number of requests, including benign requests, within the selected time range. It also displays the average number of Requests per Second (RPS). The associated chart displays the number of requests over the selected time range.
- Blocked Requests
-
Displays the total number of requests that were blocked within the selected time range. It also displays the average number of RPS. The associated chart displays the number of blocked requests over the time range.
- Max Risk
-
Displays the highest system Risk Score recorded during the time range selected. The associated chart displays the maximum Risk Score at each time interval.
| You can hover over a point on any graph to display the metrics at that time. |
Activity
The Activity table lists each attack and the time it occurred. You can drill into each threat to display its Entity Details page.
If you are unfamiliar with the Status icons, you can hover over the icon in the Status column to see its activity.
If your account has sufficient permissions, you can manually allow, block or deny entitie from the threat’s Entity Details page, IWAF Settings page, or by using the ThreatX API.
Threat Entities
The Threat Entities table found in the Attack Dashboard offers the visibility security teams need to quickly evaluate threats prioritized by the Risk Score and Intensity, which represents the number of times rules were matched over the selected time range.
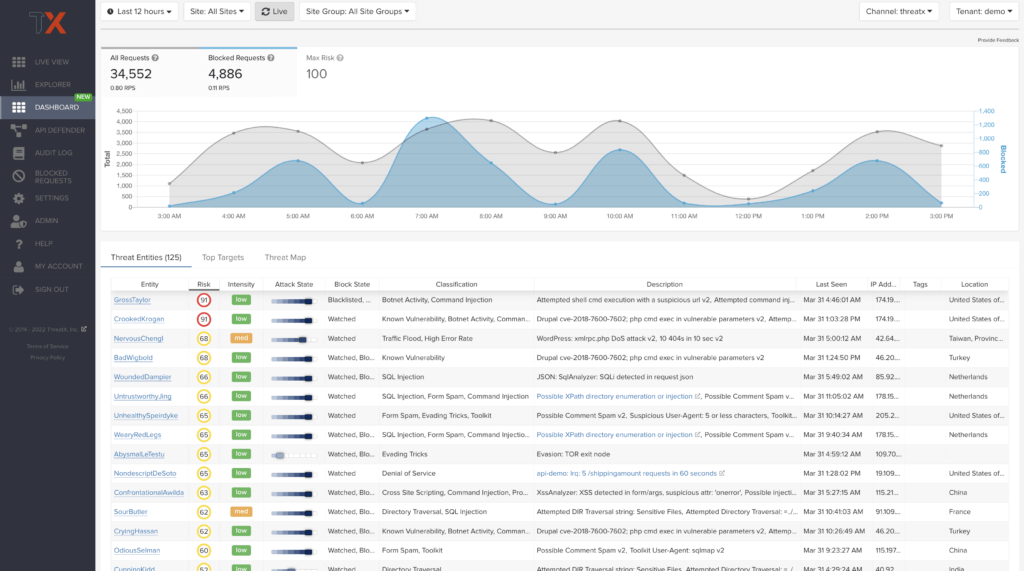
You can drill down into the threat to view its Entity Details.
| If you are unfamiliar with the Status icons, you can hover over the icon to see its definition. |
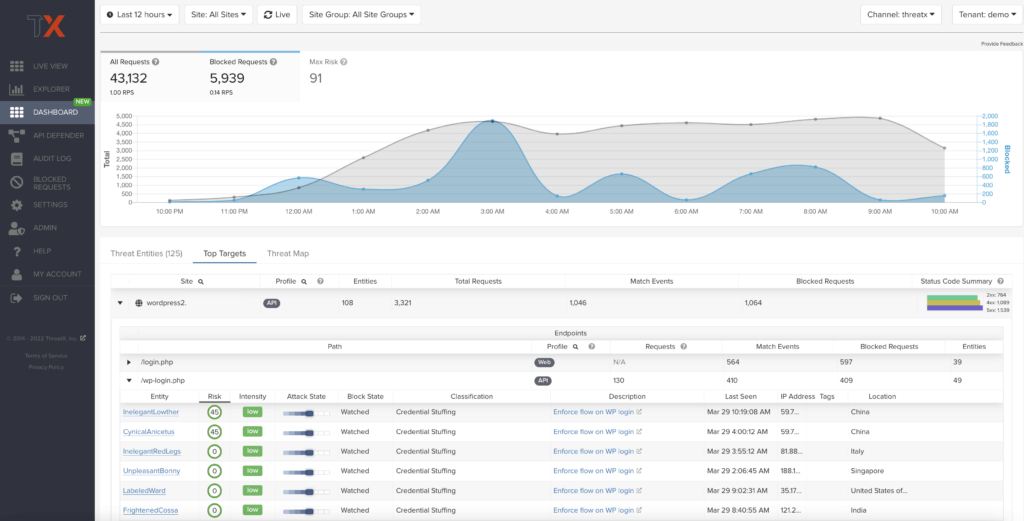
🎯 Top Targets
The Attack Dashboard’s Top Targets view puts the most frequently and aggressively targeted sites front and center, allowing administrators to understand their risk profile, and the protection they’re receiving from ThreatX.
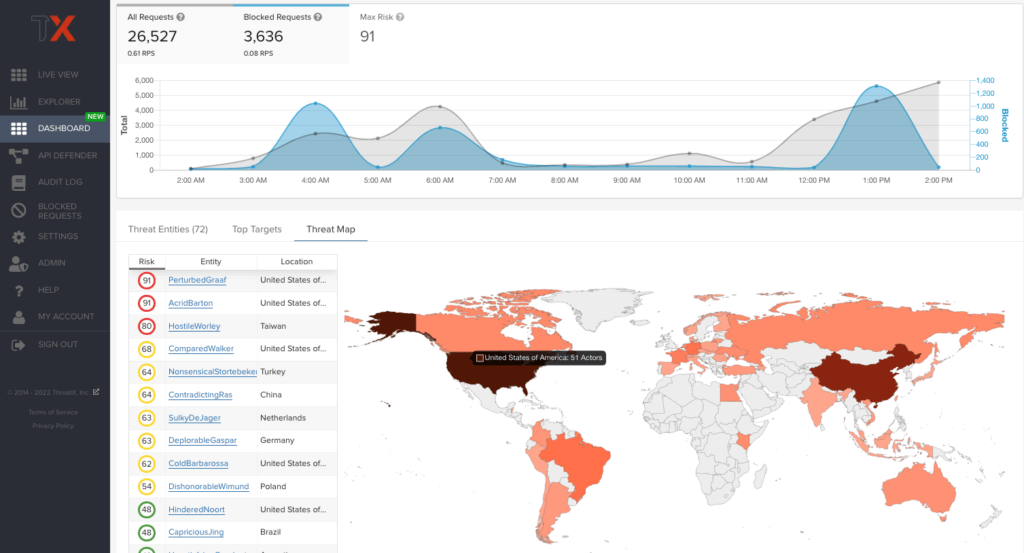
🗺️ Threat Map
The Threat Map view provides visibility into the location of each unique entity and its associated risk. You can hover over a country on the map, and a pop-up displays the number of attacking threats originating in that country.
Entity Details
The Entity Details page is accessible by clicking a threat on another page, such as the Dashboard.
The ThreatX platform analyzes HTTP traffic then extracts identifying metadata, including IP address, user agent, TLS fingerprint, and other characteristics to create a profile and identifier for each attacker, which is displayed in the Entity Details page. The data is presented with special emphasis on key attributes to further help identify trends and patterns.
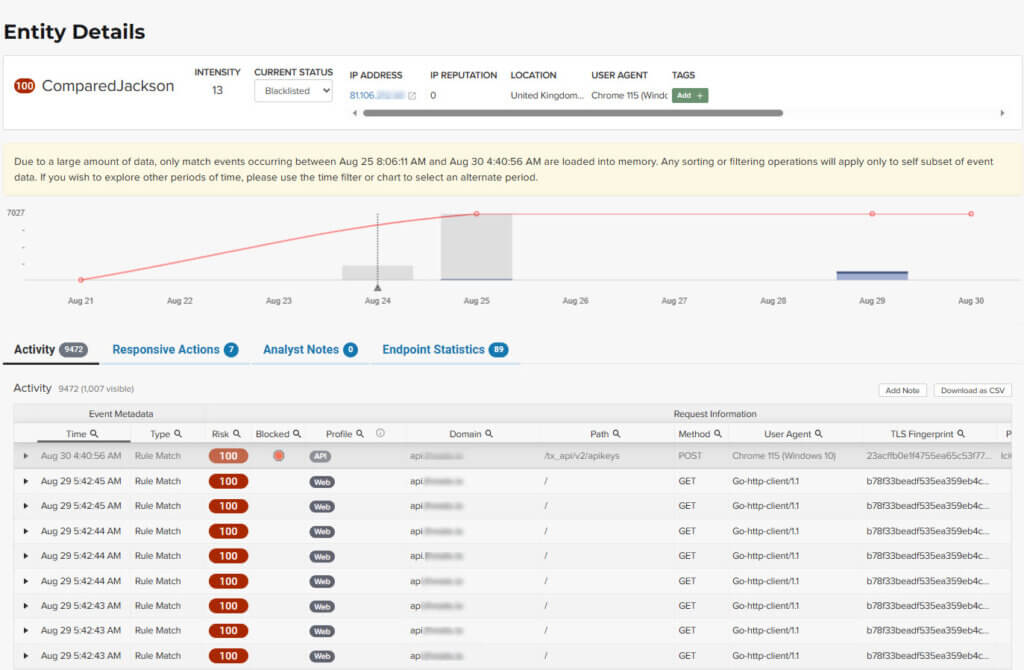
Active Threats
If a threat is active, you will see the following changes in the Activity table:
-
Additional events with Rule Match in the Type column.
-
Increasing Risk Score.
-
If your ThreatX platform has the auto-blocking feature enabled, the threat is blocked when it exceeds the auto-blocking threshold and you see a red dot in the Blocked column.
Blocking
Blocking is a temporary action and the block is released after a period of time. The Type column changes to Watched. If that entity is still active, you might see more entries with Rule Match. However, some attackers try a few requests, get blocked, give up and do not return.
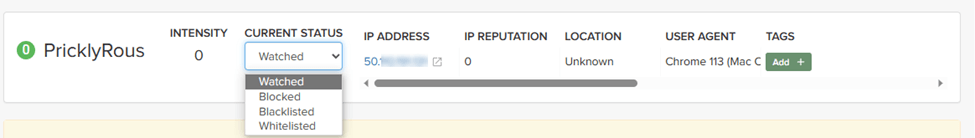
If the threat has interacted with your sites, you can add them to a list:
-
Click the threat in the Dashboard or other location to open its Entity Details page.
-
Click Current Status
-
Change it to the desired list.
To remove a threat from a list, open Current Status and select a different list or Watched.
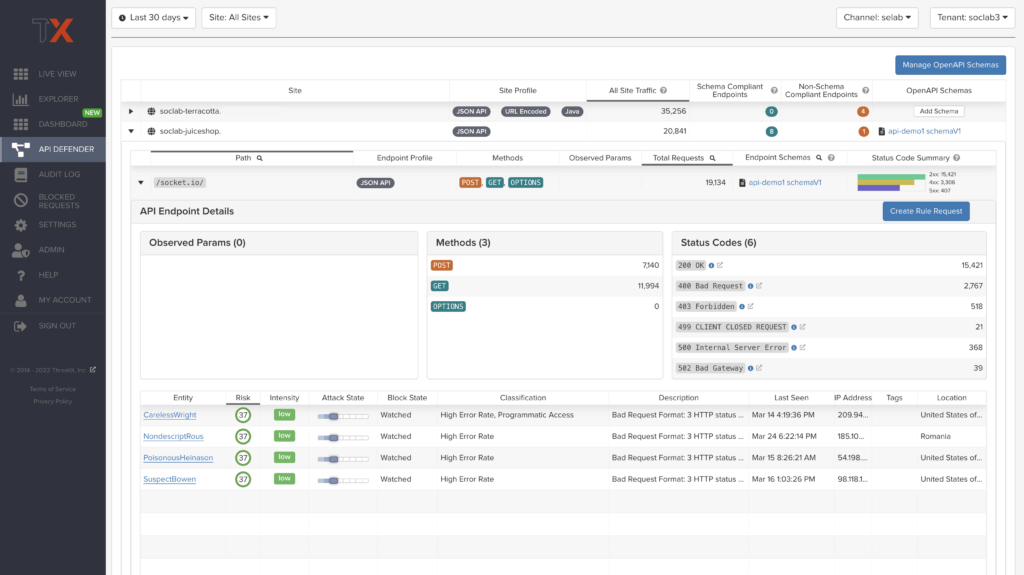
API Observability
The API Defender dashboard provides visibility into endpoints discovered and protected by the ThreatX platform.
API traffic analytics, error code summaries, and visualizations of API schema conformance are displayed in API Defender, as shown below in Figure 4, providing the ability to compare what API traffic is expected vs. an anomaly against your organization’s API specifications.
The API Defender dashboard brings together API discovery, observability, and the context needed to understand your organization’s entire attack surface against what is being seen in the wild.
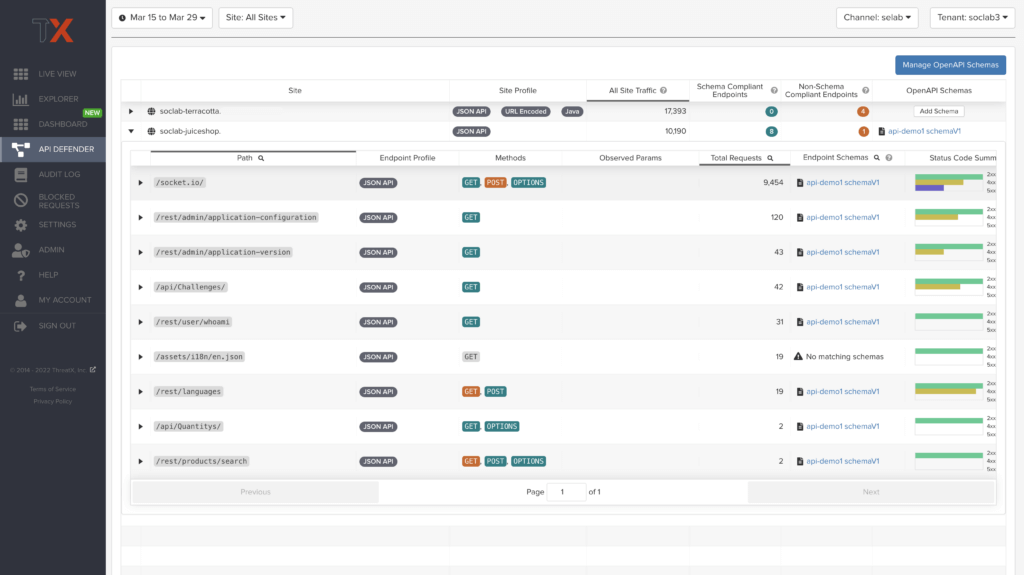
🔭 API Discovery
ThreatX’s API discovery capabilities analyze and profile legitimate, suspicious, and malicious API use to discover and enumerate the endpoints as well as the traffic they serve. While monitoring API interactions in real-time, ThreatX can accurately detect real API endpoints and determine identifying attributes of their tech stacks or markup encodings.
📐 Schema Compliance
Schema Compliance gives users the ability to upload, manage, and cross-compare which API traffic is expected according to your organization’s schema vs. what is being seen in the wild.
Manage your organization’s API schemas within the API Defender page to gain risk visibility, simplify schema enforcement, or create API-centered protection rules.
| By default, the ThreatX platform updates the data every few seconds. You can choose to display historical data by selecting a time frame, as described in Data Controls and Filters. |